01
Your target group
Understand where your customers live.
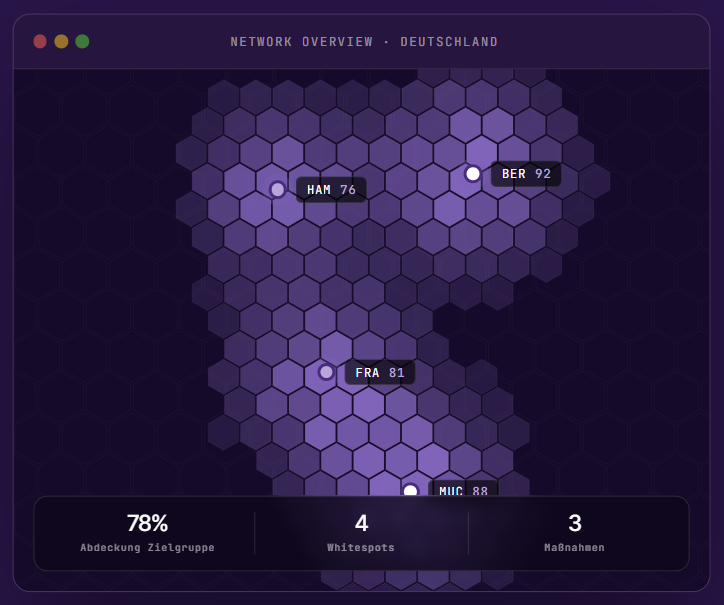
- Target-group potential per market
- Drive-time catchments
- Coverage & white spots
Serve your target group in the right place and in the right way. Plotside layers three views of every market and turns them into one network strategy.
Understand where your customers live.
Be present where it counts.
Planned city projects and market news, mapped to your markets. You see change before it reaches the street.
Serve your target group across every channel.
Now do that for every market in your network.
Every action makes the next decision better.
Every signal becomes an item
Assess and decide as a team
Actions with an owner and a due date
Track the impact over time
Good location management often shows in what no longer happens.
And the whole team decides from one shared picture.
That's why it pays to look across the whole year: from strategic planning through market news to a broker's listing. Every moment becomes a shared item, understood and decided as a team, so your network stays in step with the market.
Leadership sets the target: 5 new stores, 2 closures, 3 renewals in 18 months.
The expansion strategy is structured as a named plan. Whitespot analysis surfaces prioritised search corridors. Closure candidates are identified via Network Analysis.
Where are the high-potential areas we don't cover yet? Which micro-locations would fit the brand?
Filter the hexagon heatmap by target-group density, purchasing power and competitive density. Forward search corridors to brokers. Assess prospects together as a team.
Premium location in Frankfurt. Decision in 5 days, or the space goes to a competitor.
Pin the address, catchment in seconds, comparison with top performers, cannibalisation check against the existing store 6 km away. The briefing goes to the team as a shared item: gather input, decide together, document. 30 minutes instead of 2 weeks of external analysis.
AI-powered market news reports: a competitor is opening 300 m from your Cologne store.
One click turns the report into an item, assigns it to the Cologne market and makes it visible to the whole team. Get input first, then decide. No lost news clipping, no email chain fizzling out in an inbox.
A new store in Munich-Schwabing is planned. How much does it weaken the existing store 4 km away?
Catchment overlap and net effect quantify the risk before signing. And they show whether the location works better as a relocation than as an addition.
Which stores have reinvestment potential? Which should be put up for discussion?
Network Analysis surfaces the bottom quartile instantly. Diagnosis per store: a location problem or an execution problem? The candidates are discussed and documented with the CFO and team before any decision. AI summary for the board slide.
Three stores are 20% below forecast. Is it the location or the operations?
A catchment comparison separates a weak market from weak execution. Is the location in the structural bottom quartile? Or is it performing well below its potential?
The lease in Munich-Sendling expires in 18 months. Renew, renegotiate or relocate?
Reassess catchment and location quality. Compare with alternative sites. A data-backed negotiating position. Or a well-founded recommendation to relocate.
CEO and CFO expect defensible recommendations on a clear numeric basis.
The active plan shows the planned portfolio changes. Scorecards per store, AI summaries, a documented decision path. Every recommendation carries the team's input gathered over the year and traces back to data.
No commitment. Personal. Tailored to your store network.